
THE FABRICATOR’S SIGNAL | ISSUE 12
A bigger sales number feels like progress. A better benchmark shows whether the business is becoming more profitable, easier to grow, and capable of supporting the people who depend on it.
By Rick Phelps | Synchronous Solutions
Ask a fabricator how big the shop is and the answer will usually be revenue. “We are a $10 million shop.” “We just crossed $20 million.” Everyone understands the number. It is easy to remember, easy to compare, and satisfying to watch grow.
There is good reason to care about it. More sales can mean that customers value your work and that the company is winning business. Reaching a milestone can represent years of effort by the owner and the team. Revenue gives people something tangible to celebrate and a clear target to pursue.
The trouble begins when that sales target becomes the definition of success. You reach the next million, but there is little more profit. The owner is still pulled into every difficult decision. More work means more coordination, more cash tied up, and more people counting on a business that does not feel any stronger.
That is when the question needs to change. Are you trying to build a bigger sales number, or a business that produces more profit, can grow without overwhelming its leaders, and provides secure jobs? Those goals need a clearer benchmark. Revenue per employee is a useful place to start, provided you understand what sits behind it.
Why revenue per employee feels like a better answer
Dividing sales by the number of employees seems to improve the comparison. Instead of asking only how much the shop sells, you are asking how much business the team supports. A shop producing the same sales with fewer people appears more productive.
For that comparison to be fair, “employee” needs a consistent meaning. We use full-time equivalents, or FTEs: the amount of labor expressed as an equivalent number of full-time positions. Two people each working half time equal one FTE. Throughout this article, “per employee” means per full-time equivalent.
Count the whole operation, including sales, administration, production, and installation. The working owner’s time counts, too. A shop should not look more productive simply because the owner supplies hours that never appear in the employee count. Compare the same period on a consistent hours basis, including overtime.
That makes the labor side more comparable. But the sales side still contains a major difference: what the shop sells and how much of the customer’s payment must go to suppliers.
Look at the money the operation generates
Part of every sale pays for material and other purchased costs that vary directly with that sale. The rest is the money available to pay the people, facilities, equipment, and other costs of running the business, with something left for profit.
We call that remaining amount Throughput. It is sales revenue less those truly variable costs. Throughput is not profit; the business still has to cover its operating expenses from it.
This distinction matters because market mix changes how much of each sales dollar remains as Throughput. Retail and remodel work often includes more selling, design, communication, and service. Builder, multifamily, and wholesale work can carry more purchased material in each sales dollar. A higher sales number may therefore reflect more material passing through the company rather than more economic output from the operation.
Throughput per employee makes that difference visible. It asks how much money the operation generates, after those purchased costs, for the labor used to support the work.
The same Throughput can look like very different revenue
Consider four illustrative shops serving different markets. Each generates $150,000 of annual Throughput per employee. Translate that result into sales using the representative market mixes we see in our work, and the revenue-per-employee numbers spread apart.
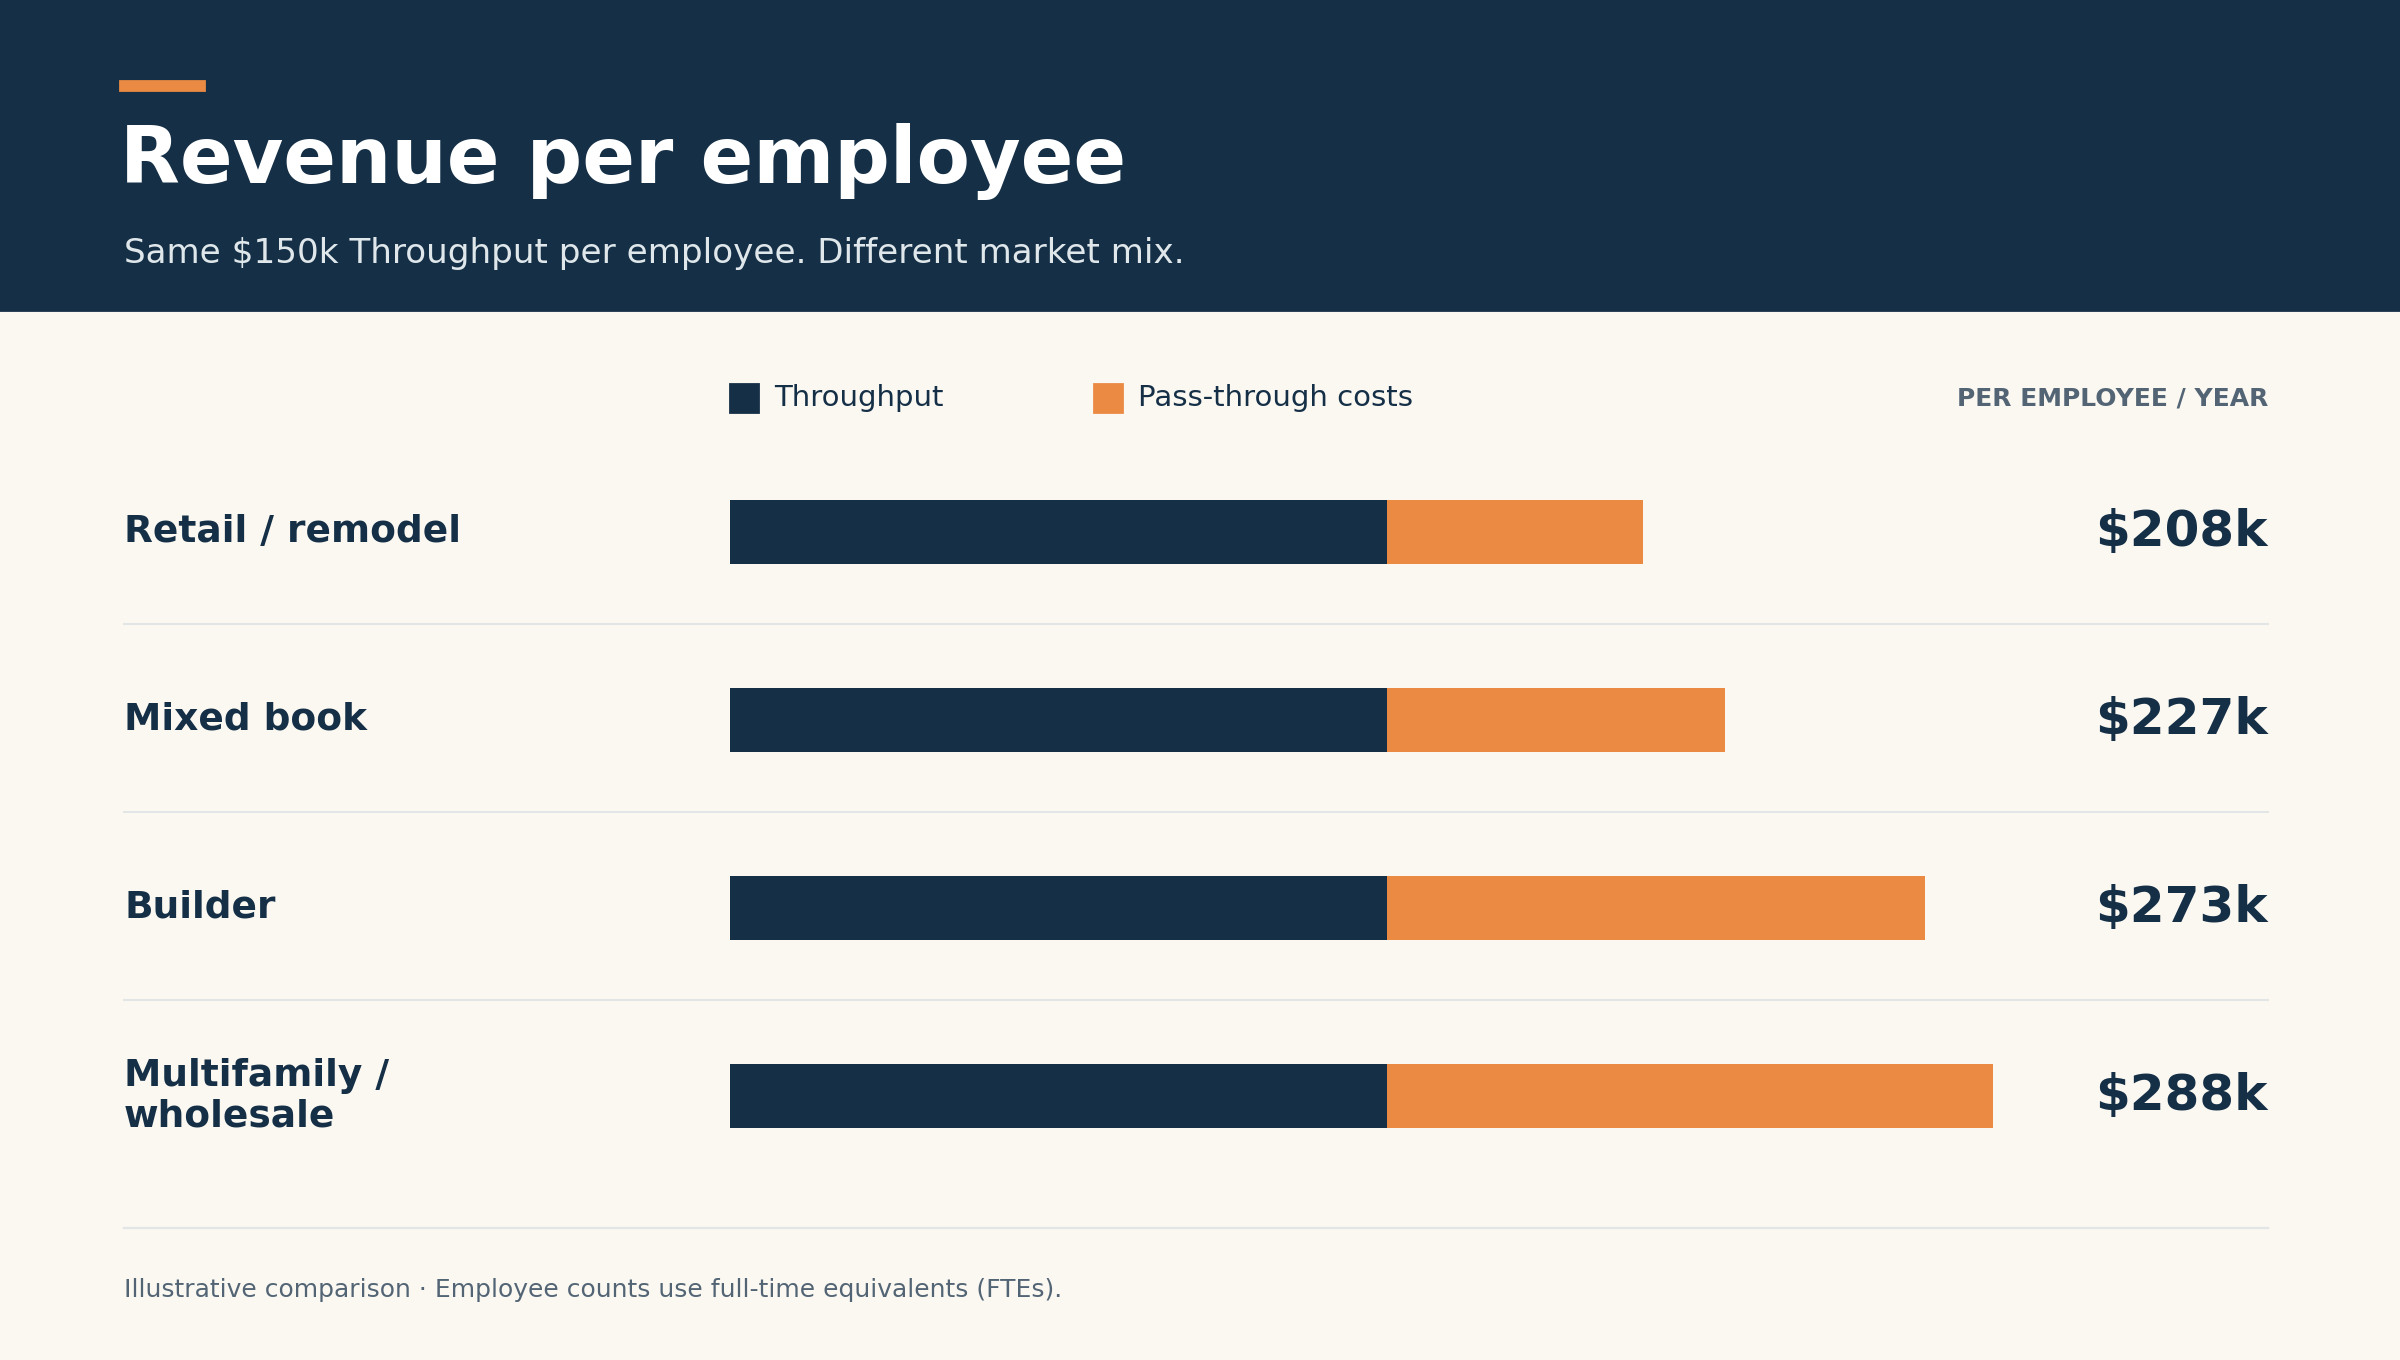
Representative operating patterns, not published industry averages or recommended health targets. The illustration uses Throughput shares of 72% for retail and remodel, 66% for a mixed book, 55% for builder work, and 52% for multifamily or wholesale.
Revenue per employee runs from about $208,000 to $288,000. The higher figure is roughly 38% above the lower one, even though Throughput per employee is identical. Judging those shops against a single revenue-per-employee target could turn a difference in market mix into an apparent difference in productivity.
The reverse is also true: matching another shop’s revenue per employee does not mean your team generates the same Throughput. Before deciding that you are ahead or behind, understand how much of that sales number the business retains after the costs tied directly to its sales.
Revenue per employee still has value, especially when you compare shops with similar market mixes and service models. Throughput per employee removes one major source of distortion when those mixes differ. Neither measure, by itself, tells you whether the shop is profitable.
A fair comparison also looks at the business model
Retail may retain more Throughput from each sales dollar, but earning it requires people, space, and management. A showroom, consumer sales team, and design consultation all have to be supported.
A builder or box-store model may retain a smaller share of each sales dollar while operating with a leaner front end. A few recurring customer relationships can support substantial volume without the same showroom staffing or consumer guidance. A higher Throughput share does not automatically make retail the better business.
The useful question is how much Throughput remains after the expenses required to serve that market. Compare the model as well as the number. Differences in outsourced work, service commitments, and staffing can matter as much as the customer category.
The people count matters in a different way
Full-time equivalents tell you how much labor the shop uses. They do not tell you everything about the organization you must lead. Ten half-time employees may equal five FTEs, but they are still ten people who need schedules, training, feedback, and clear priorities.
As headcount grows, the owner cannot remain everyone’s point of contact. Functions become teams. Teams need supervisors with authority to make decisions. Eventually, leaders need a way to coordinate across sales, templating, production, installation, and administration without sending every conflict back to the owner.
There is no universal headcount at which the next management layer becomes necessary. The work, locations, shifts, experience of the team, and strength of the operating system all influence that need. But the burden is real, even when the revenue number makes growth look successful.
That is why headcount and reporting relationships belong beside the economic benchmark. If sales rise while more decisions accumulate on your desk, the company may be getting bigger without becoming more capable of running without you.
Choose the goal before choosing the target
A useful benchmark helps you judge whether you are getting closer to the business you want to own. The goal determines what deserves your attention.
If you want more profit, look at the Throughput left after operating expenses. More sales or a stronger per-employee ratio is valuable when it improves that result. A business can look productive and still carry expenses its earnings cannot support.
If you want a business that can scale, look for growth in Throughput without people, expense, and management demands increasing at the same pace. The test includes whether your leaders can handle the larger operation without the owner carrying every exception.
If you want to provide durable employment, look at whether the business can support its people through difficult months as well as good ones. Adding positions creates lasting opportunity when the economics and management capacity are strong enough to sustain them.
Use the benchmark to see the business more clearly
Start with a simple picture: annual Throughput, the full-time-equivalent labor used to generate it, and Throughput per employee. Keep the market mix, actual headcount, and reporting structure alongside those numbers. Together, they describe what the operation generates, the labor it uses, and the organization it takes to lead it.
Compare your own progress first. Is more money reaching the bottom line? Is the team supporting more Throughput? Can leaders make the decisions that used to require you? Outside comparisons are useful when they help explain a difference you can learn from, rather than give you another number to chase.
Revenue remains an important sales measure. It becomes a vanity metric when the milestone matters more than the business it was supposed to help you build.
If sales are growing while profit stays thin, your team feels stretched, and more decisions keep landing on your desk, another revenue target may leave you with more of the same. You want growth that gives the business greater earning power, gives your leaders room to lead, and gives you confidence in the future.
At Synchronous Solutions, we help fabricators connect the financial picture to what is happening in the operation, then build the priorities, management structure, and daily disciplines needed to improve it. If the business is getting bigger without becoming stronger, let’s talk about what you want it to become and what is standing in the way.